Editor’s Note: Originally published on Mar. 11, 2021, last updated on Aug. 23, 2023.
With Q4 drawing near, now is not the time for suspended accounts. So, what better time to brush up on your Amazon seller metrics? Let’s look at what Amazon metrics are, how you can tackle them, and what else you can do to keep your business running smoothly.
As we mentioned in our post titled “Suspensions, Metrics, and POAs”, most seller accounts are suspended for violating Amazon’s policy. But for some, it’s down to poor performance. What’s so upsetting with performance suspensions is that they’re usually preventable.
Still, if Amazon flags up performance issues, don’t take it personally. The fact is buyers’ expectations change. So do Amazon’s rules, for that matter. To avoid having your account suspended, we recommend that you keep up with any fee, rule, or metrics changes.
Keep up with any fee updates in the Infographics section of our website or check the more in-depth rundown in our Amazon Seller Fees Guide. As for metrics, forget Google. Everything’s outdated or plain wrong. Here’s what Amazon metrics really look like in 2023.
17 Amazon Metrics Explained
As an Amazon seller, you’ve probably come across the term “KPIs” (Key Performance Indicators). Well, ‘performance metrics’ are Amazon’s version of that. Except Amazon metrics are usually mandatory. If they’re not good enough, your account gets suspended.
A. Fulfillment Metrics (MFN and SFP)
There are 4 major metrics every Amazon seller must monitor daily, depending on the type of fulfillment you use. Three of them apply to all sellers who fulfill their own (MFN and SFP) orders. They refer to shipping and data entry efficiency:
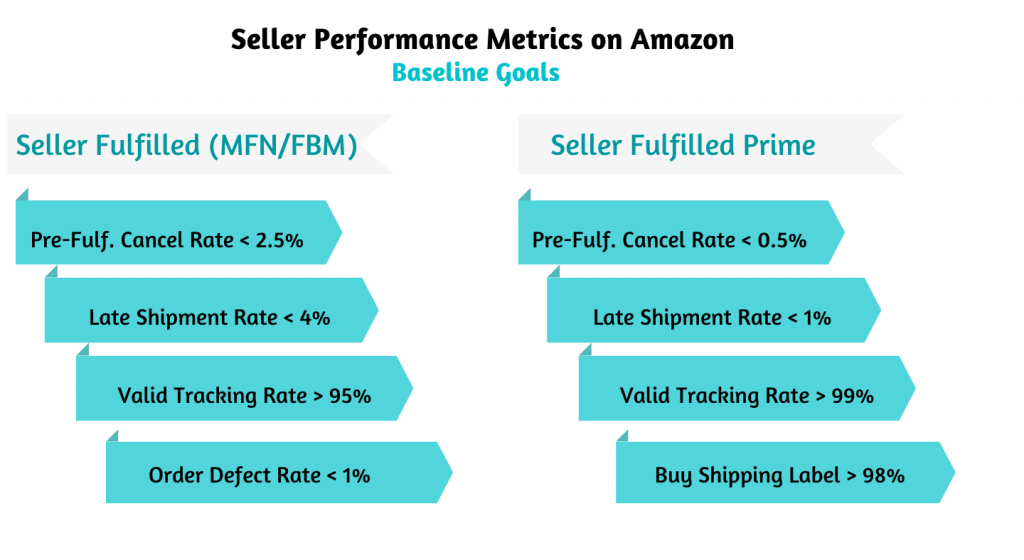
- Pre-Fulfillment Cancel Rate
PFCR is the rate at which you cancel orders before confirming dispatch.
- Late Shipment Rate
LSR is the number of times your shipment confirmations are untimely or missing, over the total number of orders you receive. - Valid Tracking Rate
VTR is the rate at which the tracking numbers you upload in a 30-day period turn out to be valid (uploaded before the delivery date and with at least one carrier scan). You get one for every product category. It’s calculated for every product category. For shipments shipped from China, there’s also the mandate to use Amazon-integrated carriers.
- Buy Shipping Label Rate (SFP only)
If you sign up for Seller-Fulfilled Prime (SFP), you need a near-perfect record for on-time dispatch and delivery, order acceptance and tracking, and data entry in your seller account. But you also need to buy nearly all your shipping labels through Amazon’s Buy Shipping tool. - Order Defect Rate (MFN only)
For MFN orders, your first 3 baseline goals are less stringent. But you also have a fourth metric related to customer service – Order Defect Rate. ODR is the percentage of orders with which buyers have a negative experience.
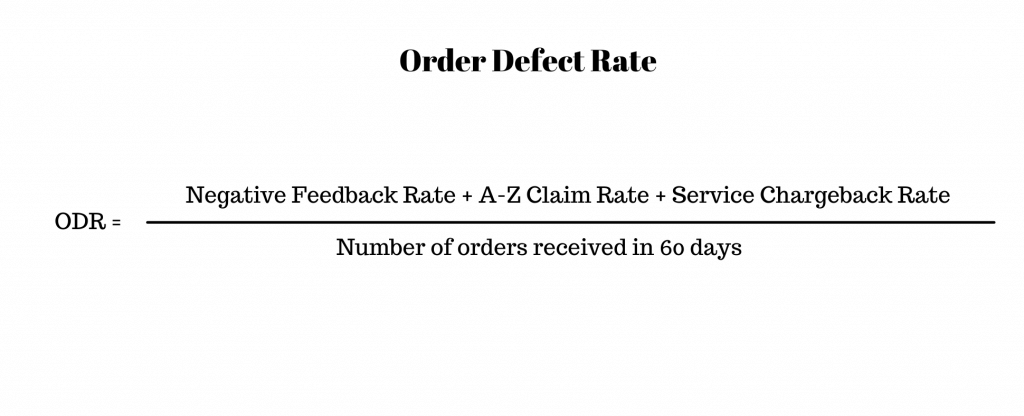
If it’s over 1.19%, your account healthAccount Health is an Amazon page which c… More rating would shift from green to yellow, and you’d also see a notification in your seller account. At this point, you’re teetering on the brink of suspension. Amazon may also send an email warning if you go over 1%.
There are several ways to lower your ODR. But you should try to focus on the formula above. Here are 8 ODR tips:
- An order will only count once, even if the buyer pulls a triple whammy (negative feedbackA performance rating on a scale of 1 to … More, claim, and chargeback).
- There’s a difference between ‘negative feedback rate’ and overall ‘feedback score’.
- If the buyer retracts the negative feedback, they also remove its effect on the ODR.
- A-to-Z claims don’t affect the ODR after they’re withdrawn.
- You have 2-3 days to resolve a claim and 30 days for an appeal. Once a claim is closed, its impact on your ODR is irreversible.
- Fraud chargebacks (where the buyer denies placing the order) don’t affect your ODR.
- Service chargebacks (where the buyer notifies the bank that there was an issue with the order) are ‘charge disputes’ that count toward your ODR.
- The smaller the ODR, the higher your chances of winning the Buy Box, as revealed in our post titled “Amazon Buy Box Secrets and How To Win It”.
- Invoice Defect Rate
The Invoice Defect Rate (IDR) is the share of orders for which you didn’t provide a VAT invoice or a receipt that the buyer can download. It should be under 5%. The rule used to apply only to Business orders, but extended to all sellers on Apr. 5, 2021, as seen here.
B. Inventory Metrics (FBA)
- Inventory Performance Index (IPI)A score between 0 and 1,000 calculated b… More
This is a number from 0 to 1,000. It’s used to assess your FBA inventory management and limit your stock levels if you’re underperforming. Amazon will assess you twice before the start of a business quarter, as explained in this video.
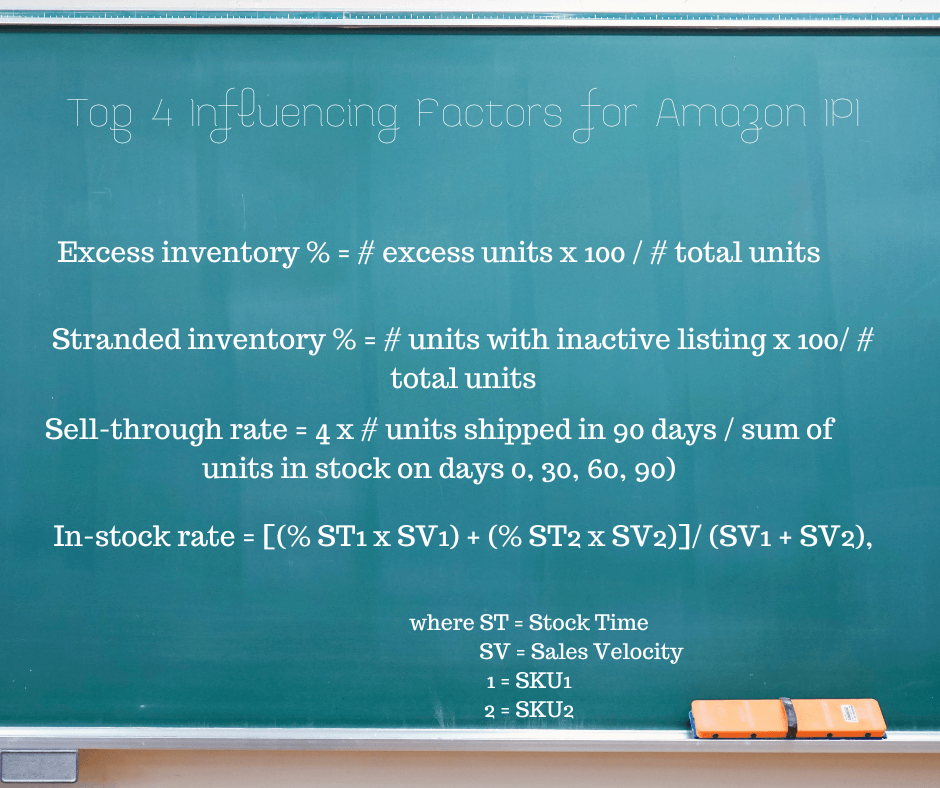
IPI is calculated based on 4 factors. They take in data from the past 3 months, but they don’t all update at the same time. So, even though your IPI score will update weekly, it might not be a true reflection of your performance. Still, these are the 4 aspects you should monitor:
- Excess inventory. It estimates the proportion of units deemed to be in excess of 90 days’ worth of demand.
- Stranded inventory. It reflects the number of units stored, but without an active listing.
- FBA sell-through rate. This is the number of units sold over 90 days, versus units usually in stock.
- FBA in-stock rate. This indicates how efficient you are at maintaining stock levels over a 30-days period, against total sales in 60 days.
The IPI requirement varies between 400 and 500. But it doesn’t apply to new ASINs, because Amazon needs a 90-day sales history to calculate it. There are 2 IPI reviews for each quarter, and you must pass at least one. Try to boost your IPI by mid-September to avoid stock limits in Q4.
C. Experience Metrics
- Negative Experience Rate
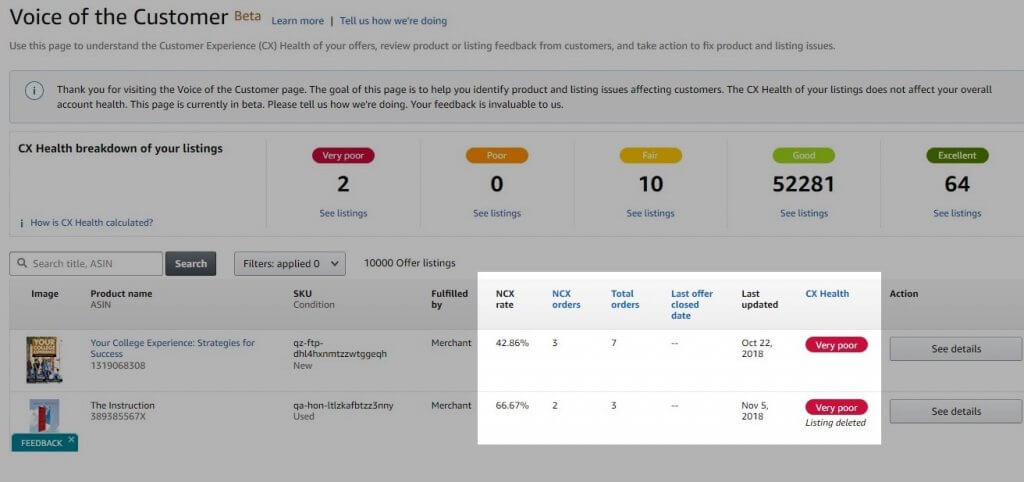
This metric is displayed in the Voice of the Customer dashboard as the NCX rate. It shows the share of orders for a specific product that lead to a negative customer report. Unlike ODR, it takes buyer messages, returns, refunds, and negative reviews into account. - Customer Experience Health
The color-coded CX score goes from Very Poor to Excellent. It compares your NCX rate with that from similar offers. To check a listing Amazon flagged up with an orange (Poor) or red (Very Poor) label, simply click ‘View listings’ and hit the label in the table below.
D. Seller Account Metrics
- Account HealthAccount Health is an Amazon page which c… More Rating
Similar to CX and IPI, the AHR is a three-tier color-coded index shown in the Account Health dashboard. It’s designed to let you know how well you’re following the rules. Any slip-ups are flagged up below it in the Policy Compliance section with a red danger sign.
For the time being, AHR only shows one of three things: Good (green label), At Risk (yellow), or Critical (red). For ways to improve your AHR, please check our recent post about the Account Health Dashboard.
E. Listing & Sales Metrics
- Sales RankThe sales rank of products on Amazon ind… More
A product’s sales rank indicates its popularity relative to other items in that category. It’s based on the number of orders per hour, regardless of units sold. The best-selling item in a category has a sales rank of 1. For more on this, please read Sales Rank: What it Is and How to Use It. - Buy BoxThis refers to the situation where a sel… More Percentage
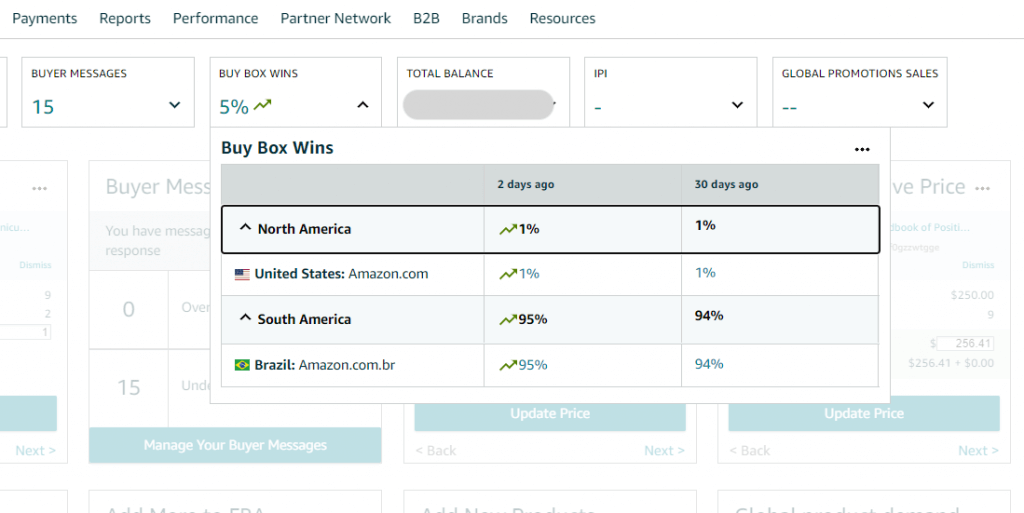
Amazon Buy Box Percentage, a.k.a. Buy Box Wins, is an indicator of how effective an offer is at winning the Buy Box. It’s the number of times you owned the Buy Box when customers viewed your listing, divided by the total number of page visits. It only works with active listings.
Amazon calls it “Buy Box Wins” and calculates two separate values for it in Seller CentralAmazon Seller Central is a portal or a h… More. One is for your Buy Box percentage over the last 2 days, and there’s another one that spans a 30-day period. The first comes with a handy little trend arrow icon.
- Session Percentage
This is the percentage of times customers who visit an ASIN’s detail page go on to buy that product from you. Low session percentage is an indicator that the listing information is poor or that you’re not winning the Buy BoxThis refers to the situation where a sel… More as much as you could be. - Unit Session Percentage
Unit Session Percentage Rate is Amazon lingo for conversion rate. You can think of it as total sales out of the total number of views your listing got. There’s no threshold for it. But as Amazon includes mobile conversions, according to Search Engine Journal, you should strive for 7%-15%. - Product Ranking
Product Ranking impacts the visibility of your offers. Amazon’s so-called ‘A10 algorithm’ is an elusive metric that factors in seller authority, sales velocity, selling history, impressions, click-through-rate, conversion rate, pay-per-click sales, organic sales, off-site sales, and reviews.
F. Campaign Metrics
- Advertising Cost of Sale (ACoS)The ACoS (Advertising Cost of Sale) is a… More
ACoS shows your PPC campaign’s performance. It’s the ratio between ad spend and targeted sales. According to WebFX, you should aim for an ACoS of 15%-20%. For ways to lower your ACoS, please read our PPC post and our Amazon ACoS overview. - Return on Ad Spend (RoAS)
As a seller, you may find that other KPIs are more relevant to your business model. For instance, Return on Ad Spend (RoAS) is a good indicator of your campaign’s performance on Amazon. A ratio of 3:1 is reasonable, but you can tweak it in your CampaignSellers and vendors have a variety of ad… More Manager, as seen below.
We hope that our list of Amazon metrics provides a bit more clarity as to which metrics to keep an eye on for the rest of 2023. And now that you’ve had your Amazon performance metrics explained so neatly, why not follow our blog? We’ll keep you up to speed with new Amazon seller metrics, fees, policies, and expert interviews.

Melanie takes an active interest in all things Amazon. She keeps an eye on the latest developments and keeps Amazon sellers up to speed.