On Amazon, the software sellers use makes all the difference. In recent years, the use of Amazon analytics tools has soared, and with good reason. Amazon analytics provide valuable insight into the market, the platform, and the seller’s performance. Let’s look at 5 essential Amazon analytics for sellers.
Why Is Amazon Data Analytics Important for Amazon Sellers?
Analytics is a process of discovery. It uses math, stats, and algorithms to detect patterns in a dataset.
Registered brands benefit from free access to Amazon analytics via the Brand Dashboard.
It displays essential information about buyer behavior, demographics, alternative products, search terms, conversions, and off-Amazon ad performance through Amazon Attribution.
But when it comes to Amazon analytics for sellers who haven’t signed up for Brand Registry, the information isn’t as forthcoming.
Sellers must rely on their own Amazon analytics tools, either off-the-shelf or developed in-house.
Alternatively, they can outsource this part of their operations to a specialist.
5 Top Amazon Analytics an Amazon Seller Should Monitor
In general, data analysis can provide essential insights about sales, customer expectations, preferences, alternatives, seasonality, and zonality.
But for sellers, Amazon analytics may also apply to Buy BoxThis refers to the situation where a sel… More ownership, pricing, inventory, competition, and campaigns.
So, in terms of Amazon analytics for sellers, it’s essential that they produce 5 main types of information:
5 Essential Amazon Analytics From BuyBoxBuddy and What They Mean
BuyBoxBuddy covers most of the Amazon analytics mentioned above (Buy BoxThis refers to the situation where a sel… More, inventory, price, and competition analytics), and several others to boot.
Let’s discuss a few of these essential Amazon analytics for sellers, showing how to harness the information they yield.
Buy Box Ownership
On Amazon, owning the Buy BoxThis refers to the situation where a sel… More is something all sellers should strive for.
Optimizing Buy Box ownership makes it more likely that buyers will see the product page while you own the Buy Box.
This, in turn, boosts a metric called the Buy Box Percentage or Buy Box Wins, which is influenced by ownership and total pageviews.
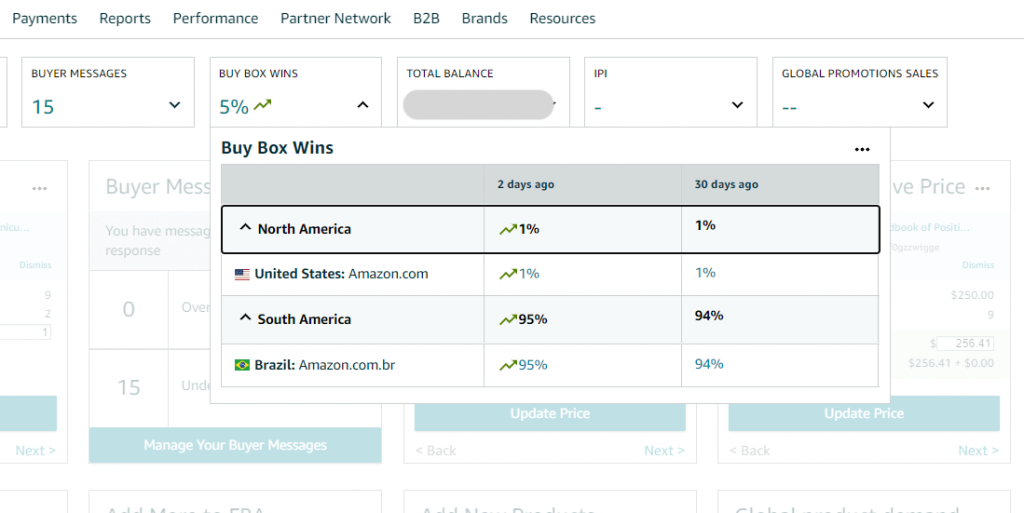
While this metric is important, the fact that it’s based on pageviews makes it harder to control.
After all, unless you invest heavily in well-timed ads, you may not be able to steer buyers to the product page at the exact time you own the Buy BoxThis refers to the situation where a sel… More.
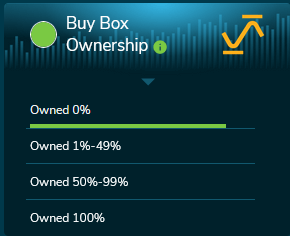
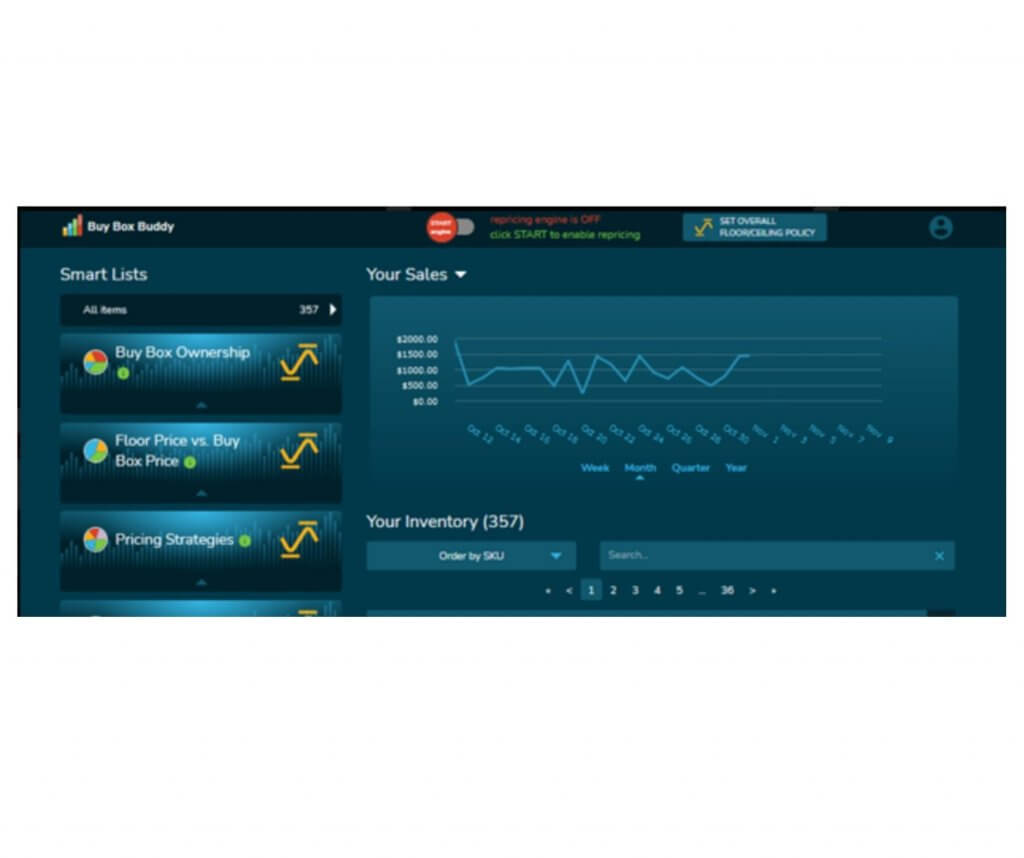
Luckily, BuyBoxBuddy can help give you a clearer picture of your Buy Box ownership.
With BuyBoxBuddy, your listings are grouped into Smart Lists that reveal how long you own the Buy Box over a 24-hour timeframe.
There are four such Smart Lists, showing offers that never had the Buy Box, always had it, or had it for less or more than 50% of the time.
This points to missed opportunities, easy wins, and areas for improvement.
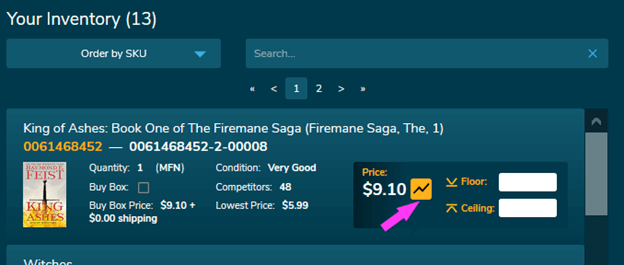
Price History
BuyBoxBuddy isn’t just about Smart Lists.
It also comes with handy little trend arrows and graphs.
The price history section on the dashboard reveals fluctuations in the Buy BoxThis refers to the situation where a sel… More price at a glance.
This gives you the opportunity to tweak your floor and ceiling price on the spot to maximize your chances of winning the Buy Box.
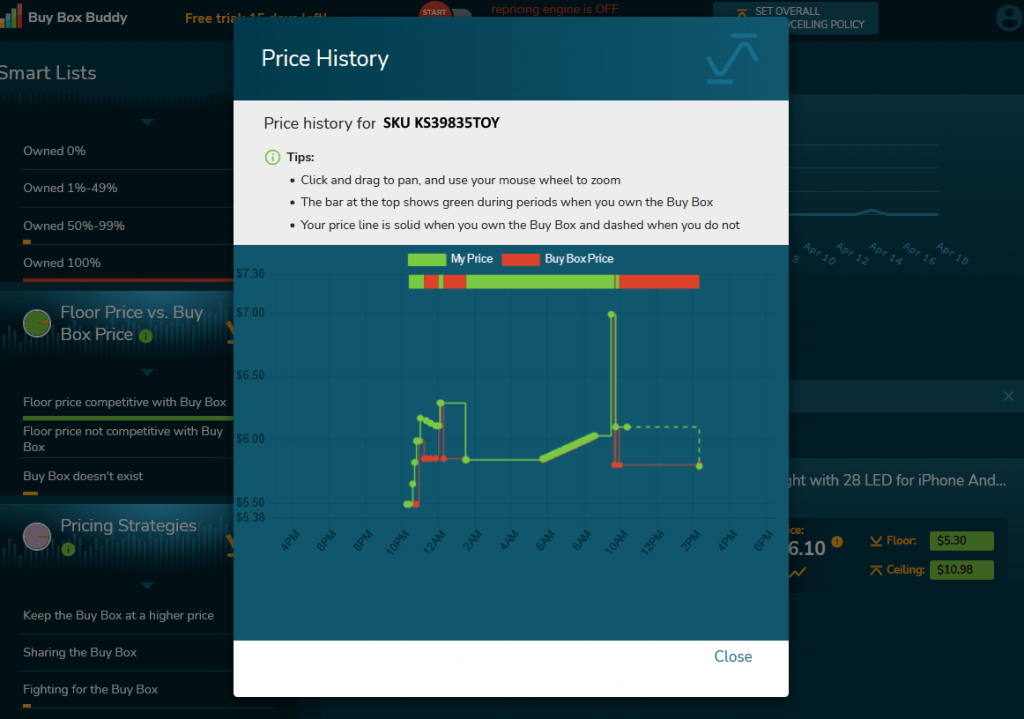
As for the price history graph, this interactive tool shows the exact timing of Buy BoxThis refers to the situation where a sel… More ownership alongside price changes.
This enables you to view the effects of your price tweaks in real-time and over a period of time, as well as understand how successful competitors are in their pricing strategies.
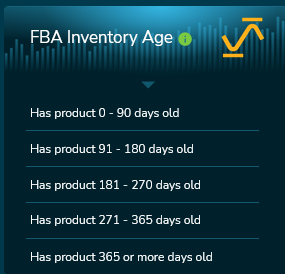
FBA Inventory Age
This feature helps sellers with FBA inventory visualize how long their inventory has been stored at fulfillment centers.
There are 5 Smart Lists in this section, which group your offers into 90-day sets. This enables you to address offers that are close to the 365-day deadline for long-term storage fees (LTSFs), estimate monthly storage fees, and pick items for disposal, liquidation, or donation.
It also highlights items you may want to stock up on.
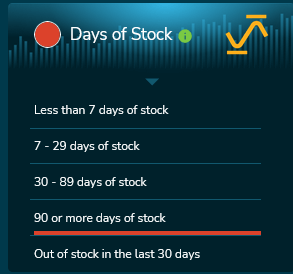
Days of Stock
This is a feature that applies to all items in your inventory, be they FBA, MFN, or SFP offers.
It looks at what was sold in the last 30 days and forecasts inventory levels for your SKUs.
It then groups the results into 5 Smart Lists.
They indicate items that sell well, need replenishing, are unlikely to sell quickly, and those that may need a new pricing approach (e.g., lowering prices, bundling).
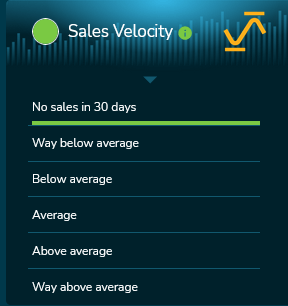
Sales Velocity
Also applicable to the entire inventory is the Sales Velocity analytics feature.
It consists of 6 Smart Lists that display products with sales results that are below or above average.
By ‘average’ it means the median sales-per-day figure for all items in your inventory, from the most to the least sold ones.
One of the Smart Lists also shows items that have had no sales in 30 days, to help inform your restocking, listing, and pricing strategies.
Together with the Sales Graph available on the dashboard, this analytics tool can also indicate the items in your inventory that brought the most and least revenue over your specified period of time.
This can also inform your restocking efforts and your pricing tactics.
We’ve only skimmed the surface of all the Amazon analytics for sellers available with BuyBoxBuddy here.
Please follow our blog for more exciting insights into Amazon analytics.
Also, please feel free to share with us what you find most useful or insightful in any of the many Amazon analytics tools available on the market today.

Melanie takes an active interest in all things Amazon. She keeps an eye on the latest developments and keeps Amazon sellers up to speed.