
Some performance metrics come and go. But the most important Amazon performance targets have stood the test of time. Let’s see how the rise of Amazon as a leading e-tailer has led to stricter requirements for marketplace sellers.
Amazon has changed substantially over the past ten years. And so have marketplace sellers. Gone are the days when merchants kept a spreadsheet of their KPIs to stay in Amazon’s good graces. For the best part of the last decade, they’ve been able to check their Amazon performance metrics through Seller CentralAmazon Seller Central is a portal or a h… More.
The Importance of Amazon Performance Metrics
Metrics determine if you’re eligible to sell certain items on Amazon. Even back in 2016, sellers knew that certain brands and categories were only available to some sellers. These were merchants with excellent performance metrics. So, the categories were called ‘gated’.
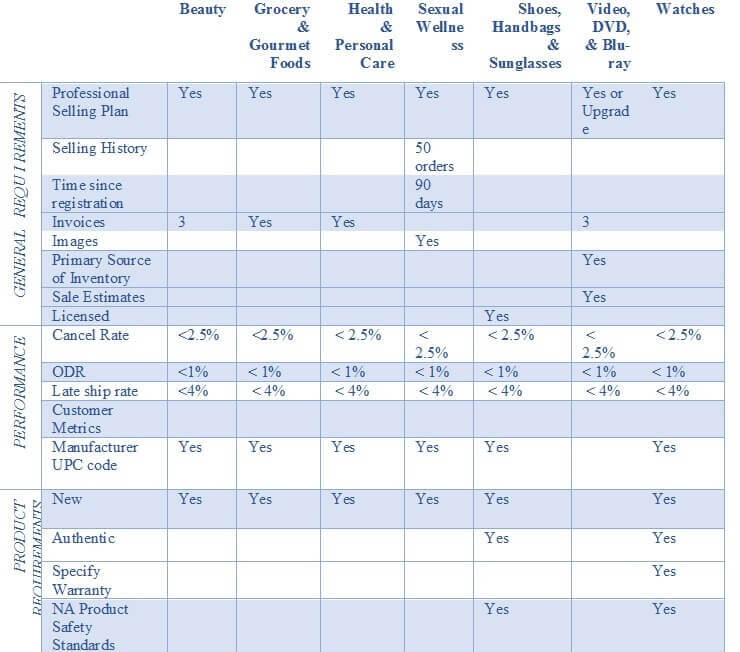
Performance metrics also affect your ability to sell at certain times of the year. And through a variety of channels. For years now MFN toy sellers have had to meet stringent requirements to sell in the holiday season.
Last year, for instance, sellers were only allowed to sell and fulfil their orders for toys and games in Q4 if they didn’t exceed these rates:
- 1.75% Pre-Fulfilment Cancellation Rate in September.
- 4% Maximum Late Shipment Rate in Sep. 2018.
- 1% ODR on Oct. 1st.
That’s not all. Performance metrics also affect your overall selling rights on Amazon. Let’s say your account is suspended. Amazon will take your performance into account before reaching a decision.
Major Changes in Seller Central
New performance guidelines called for more visibility. So, Amazon sellers were granted access to a reports module in 2010. In 2013, they also had a Business Reports page. But in 2015, Selling Coach Beta came with a new way to display reports.
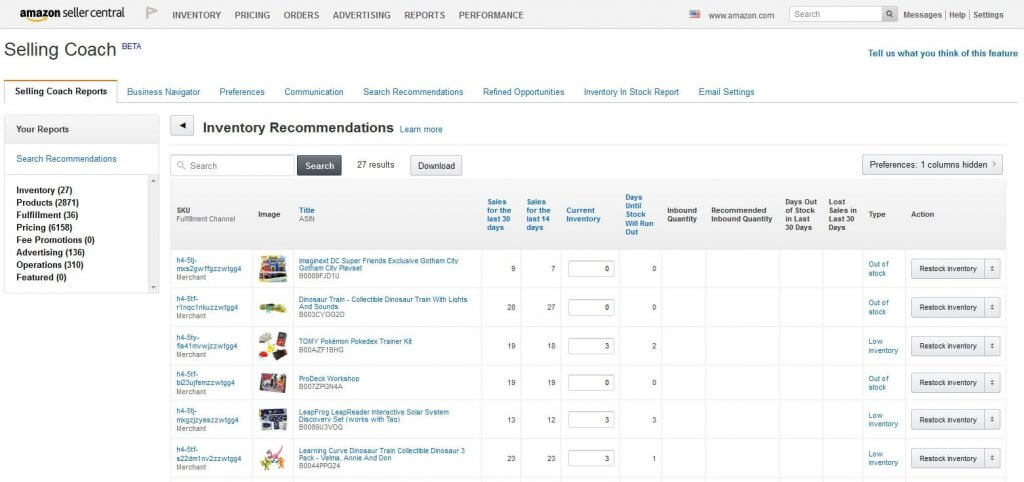
Amazon even had a few ‘hidden reports’. Sellers found the Reports and Metrics at a Glance page especially helpful, because it gave them more visibility over click-through rates.
Also in June 2015, Amazon launched the Beta Manage Inventory page. And only a month later came a brand new metric, Valid Tracking Rate (VTR). This was a game-changer for marketplace sellers.
Performance Metrics Changed Too
Valid Tracking Rate is the ratio of valid and shared tracking numbers out of all confirmed shipments. Simply enter the tracking number in the corresponding field on Amazon to share it with the buyer. Amazon checks and counts it automatically.
The catch is that a tracking number is only valid if at least one courier scanned it at least once. Anything that never reached the courier (e.g. a buyer cancellation) brings down the rate. Also, some of the parameters are wrong (e.g. Delivered on Time counts invalid tracking too).
With this new Amazon performance metric came a new requirement. For some categories, a rate above 95% became compulsory for shipments within the US, as seen above. Then, in February 2016, the requirement for 95% VTR extended to all orders.
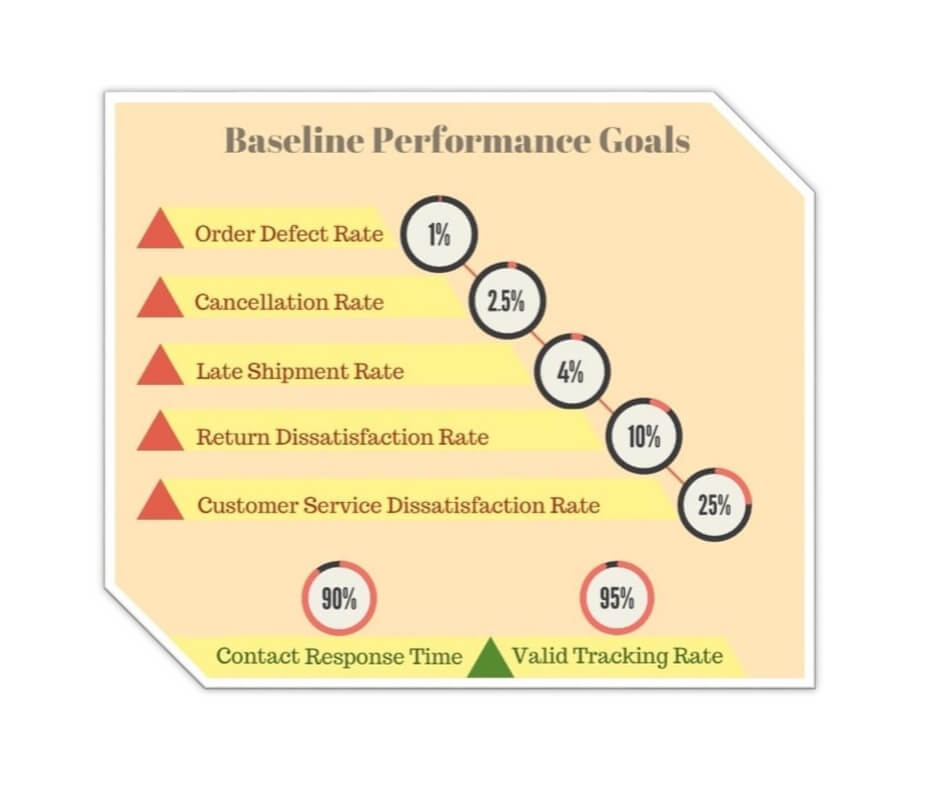
By mid-year 2016, sellers had a very clear picture of their baseline performance goals. They had specific targets for their Cancellation Rate, Order Defect Rate (ODR), Late Shipment Rate, and customer metrics.
Most of the work went into keeping the ODR below 1%. And it wasn’t any easier back then than it is today. For one thing, even A-to-z claims where you agree to a refund affect the ODR, as explained here. And they still do.
Then, in 2018, Amazon changed the way some Amazon performance metrics were displayed. Though these three metrics continued to be compulsory, they were no longer shown on the Seller PerformanceA measure of how well Amazon sellers are… MorePerformance NotificationsWarning messages sent by Amazon’s Sell… More Page:
- The Customer Service Dissatisfaction Rate (CSDR). This is the ratio of ‘No’ votes out of the total given by buyers to your messages. It should be under 25%. Only the last vote counts.
- Contact Response Time. A measure of how long it takes the seller to reply to buyer messages. Ideally, at least 90% of messages should have a reply within 2 days.
- Refund Rate. There’s no upper limit for your refund rate. But Amazon will take this into account when there are conditionProducts can only be listed on Amazon if… More or quality complaints against you.
Before long, the Return Dissatisfaction Rate (RDR) followed suit. It was made up of three rates:
- Negative Return FeedbackA performance rating on a scale of 1 to … More Rate – when buyers rate their experience for valid returns negatively.
- Late Response Rate – when you go over the 48-hour deadline to authorize a return, issue a refund, or close a request.
- Invalid Rejection Rate – when you don’t authorize returns, refund, or otherwise resolve an issue to the buyer’s satisfaction.
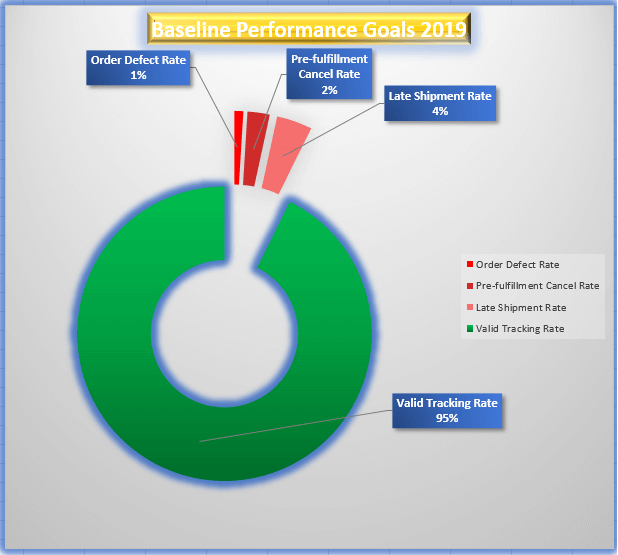
Current baseline goals for performance metrics are as shown above. Ideally, VTR should be higher than shown there in green, and the rates shown in red should be lower.
Note: These rates don’t add up to 100% because some categories can overlap and some stand for opposite situations. An order can be counted twice, for example: once for valid tracking, and another time for a claim that counts in the ODR calculation). Or it may not be part of any category.
Account Health
In December 2016, the Inventory Planning feature was launched. It came with key inventory metrics and listing performance alerts. But this change paled in comparison to how metrics were displayed in the new Account HealthAccount Health is an Amazon page which c… More dashboard.
Product Performance, for example, came with a list of Top Performers and Bottom Performers. It signalled issues and showed you items worth reordering. This metric was calculated based on:
• Percentage of imperfections for the trailing 90 days.
• Most sold and most recently sold products in your inventory.
Perfect Order Percentage (POP) counted all your perfect orders. That is, every order that wasn’t shipped late and the buyer didn’t ask about it. It only counted if you didn’t get any negative feedbackA performance rating on a scale of 1 to … More, claims, refunds, or chargeback cancellations. A score of over 95% over the past 90 days was ideal.
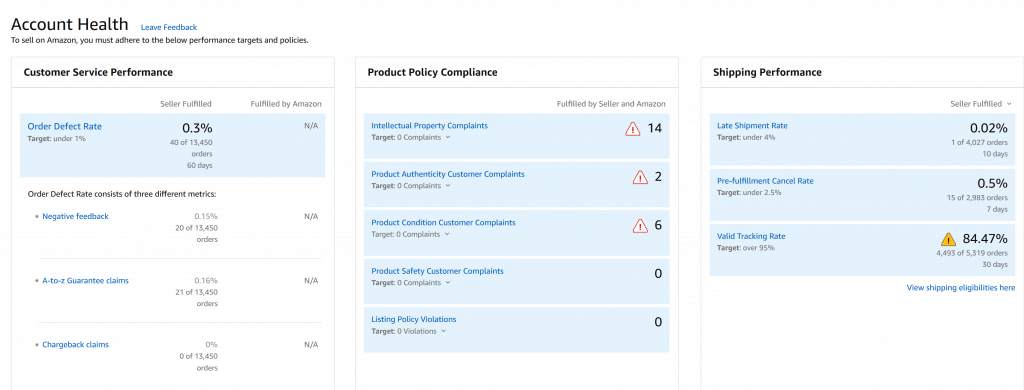
But here’s what the Account Health dashboard looks like today. As seen below, baseline performance targets are still the main metrics on Amazon. Alongside them, the Product Policy Compliance menu goes to show that things continue to change on Amazon.
That’s a wrap from us today, and we hope this trip down memory lane has helped put things into perspective. If you’d like to know more about Amazon performance targets for marketplace sellers, browse our blog and sign up to our newsletter. We’ve got plenty of advice to share; not just on performance metrics, but on all things Amazon.

Melanie takes an active interest in all things Amazon. She keeps an eye on the latest developments and keeps Amazon sellers up to speed.


