Part of the secret of making the best out of your inventory capability and pricing strategies is reading your business reports properly, as they can be useful for your long-term selling plans.
Find out which is the most popular business report used by merchants.
Business reports offer highly valuable stats for two main reasons:
- They lay the groundwork for pricing strategies meant to boost your sales.
- They reveal how visible your inventory is and how good of a job you’re doing at converting page views into sales.
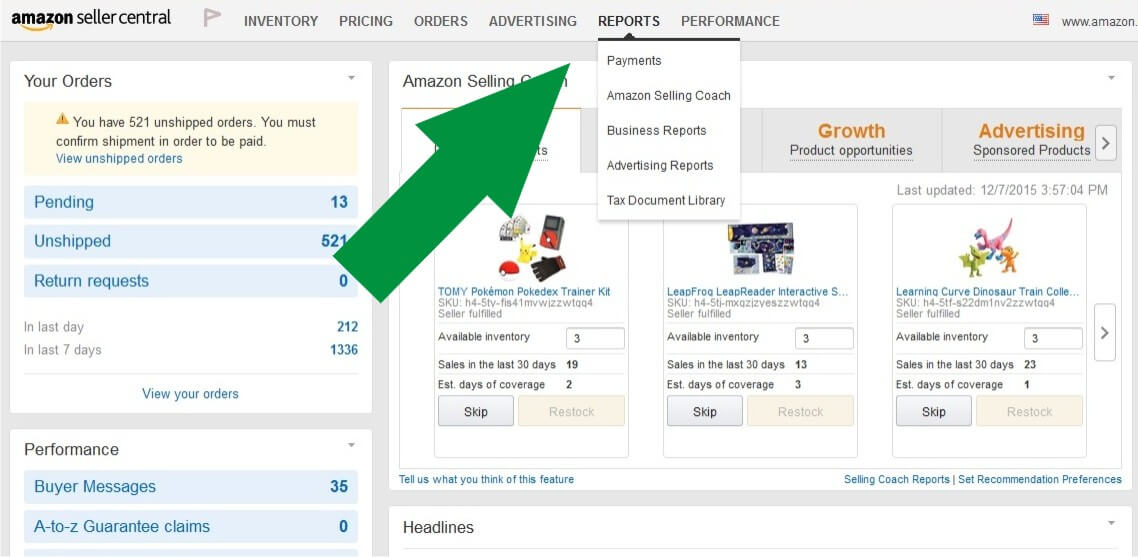
The Business Reports are, unfortunately, not that user-friendly, but Amazon appears to have finally started clearing the clutter with some changes. On July 6, 2015, some of the Seller Central Business Reports were moved to the new Selling Coach Reports page.
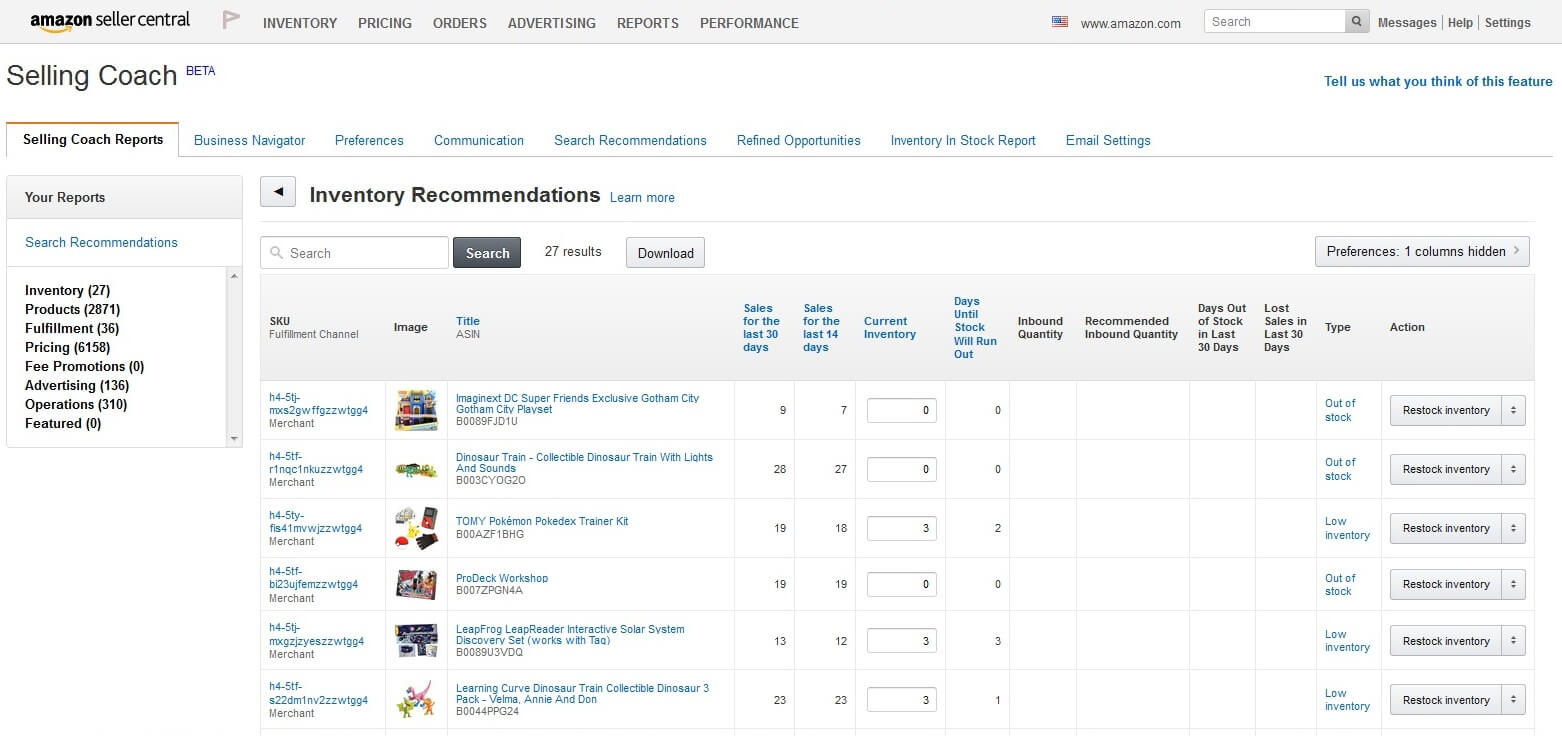
This new page comes with some important improvements based on seller feedback, including the ability to hide columns, filter and sort recommendations, and search by ASIN, product name, brand, category, and UPC to find a listing. The remaining sections of the Business Reports page (Sales Dashboard and Business Reports) stayed the same.
Most commonly used Amazon business report
The majority of sellers have made it their policy to check this report regularly: Detail Page Sales and Traffic by Parent/Child Item. Here’s how it helps:
Figure out best pricing strategies by checking your Buy Box percentage
Having a solid idea on how many times you win the Buy Box on an item is one of the most valuable information business reports can give. Look for the column called Buy Box Percentage in the report mentioned above. It can be sorted ascending or descending. Check the numbers to figure out how good your strategies are in winning the Buy Box, and when you need to tweak your pricing.
A high Buy Box percentage usually brings in a lot of sales. So you might find it interesting to investigate products that:
- Don’t win the Buy Box often enough (check who your competition is, what they price at, and how eligible you are to win the Buy Box compared to them; when there’s nothing wrong with your performance, work on being more competitive; choose to reprice faster or smarter)
- Win the Buy Box a lot, but still don’t sell well (this could mean that your prices and probably your competitors’ prices, too, are a bit high, so check the market for similar products to see what they are priced at; remember to consider item price plus shipping, especially when selling in categories that allow customized shipping costs).
Know the traffic on your items
In the same report, the column called Unit Session Percentage indicates how many units were purchased relative to the number of people who viewed the product.
If the percentage is higher for some products rather than others, it’s worth comparing them to see if any of these items are described or priced better.
If a lot of people view an item, but don’t end up buying it from you then you need to check your feedback, shipping settings and item notes, comparing them to your competition’s. If they look similar, it’s probably a matter of price; you’re either not competitive enough, or are selling at too high a price compared to similar items on the market.
If an item has low page views but you believe in its potential, you can choose to drop your price below your regular margin until you build a sales rank for it. If you’re already functioning at low margins, you can use Amazon sponsored products (provided the category you sell in is eligible), to make your inventory more visible. Another option is for you to use Amazon Top Reviewers; you’d basically send them free samples of the inventory, and they would post a review about the products, which can also increase visibility.
For an overview on how well you’ve perfected your pricing and marketing strategies, you can check the Order Item Session Percentage Column in the Report by Date called Sales and Traffic, and set it to go at least 6 months back. Make sure you know how to read and use the data these reports give you, as they can definitely complement a good backend strategy for pricing and sales boosts.

Elena is part of the Business Development team at SellerEngine. She explores online expansion opportunities and goes by the saying
“If you can’t explain it simply, you don’t understand it well enough”